The starting point in data is the observation that for the first time in many years, the sea ice extent for the Arctic was recently close to the climatology. Even spending most of the last 4-6 weeks less than 2 standard deviations below climatology. On the scale of observations, this is hardly terribly exciting -- a few days that were close to what had been the norm, and a month that was not drastically below normal (2 standard deviations below normal means below 98% of all observations). March, for the month, nevertheless, was below normal:
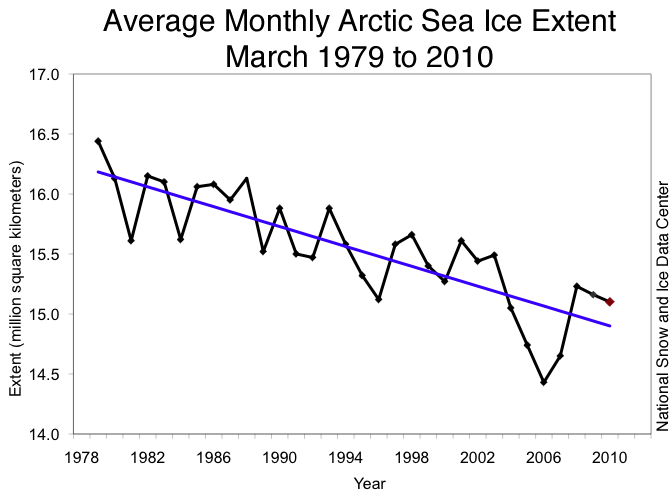 NSIDC trend line for March.
So how do we reconcile the two observations -- one of a few days being near normal and the other of a monthly trend continuing, and monthly average being below normal?
As you'd expect, we pay attention to more than one thing at a time, and we remember that weather is not climate.
On the weather and climate side, a few days can be quite deviant from the norms. Here near Washington DC, we've been 30 F above climatology yesterday and today (17 C). Quite an extreme excursion, but it'll be cooler tomorrow and is forecast to be back about normal on Saturday. Same sort of considerations apply to sea ice extent, and, less so, area.
Remember that extent is that we add up all grid cells in our analysis which have more than 15% of their area covered by ice. In area, we add up only the area that is covered by ice. For a number of purposes, particularly in summer, extent is much more reliable a figure than area. But about this time of year, that's less the case, and you can have large fluctuations in a few days. The monthly average, however, is less concerned with a few unusual days.
More than one thing going on at a time is a different part of the story. In thinking about there being an ice cover, there are two things that we have to pay attention to. One is freezing and melting -- if you freeze lots of new ice, you have greater ice extent. If you warm up, you melt off the ice and have less ice extent.
On the other hand, if you blow ice towards open water, you also increase the ice extent. At least you do until the ice melts. One thing that can happen is to set up a 'conveyor belt' -- freeze ice in one area, and blow it towards another. That has some interesting effects on the ocean. You can also greatly reduce the ice extent for a few days -- have the winds blow the Arctic ice back towards the north pole.
In March (see the NSIDC story), it looks like both a cold spell (freezing ice in the interior) and conveyor (carrying the ice towards the edge and expanding the edge) set up for a while. I'll leave it to others to check WUWT and the like to see whether they're as fond of wind as an explanation for the brief approach to normal ice conditions as they were with it as an explanation for the record minimum of 2007. If they are honest, they are touting winds just as strongly now as before.
Scientifically, winds being involved were no news. Winds are part of the climate system, along with temperatures. We (folks who look at sea ice) always knew that. It's always better to nail down just how much is going on due to each cause, so people write that up in the scientific literature.
So my guess for where we are in the Arctic: The ice formed by late season freezing and conveyor belt is thin. There has not been time for it to freeze thickly, nor for it to get mechanically piled up to be thick. The expansive winds that lead to the increase in extent also mean driving the ice towards warmer water. If the current pattern of blowing the ice out towards the edge were to be sustained, it points to a temporary high value for extent, and then a rapid drop in extent as the ice melts, or as winds reverse and compact the ice pack.
Whatever the details, still no reason for me to change the prediction method I used last year for guessing the September average extent.
In the mean time, go here for animations of the last 30 days sea ice. And over here, you can see animations by month. Lots to be desired in both places, not least that the color bar and flag values change over time, as does the satellite data source. Still, it gives a feeling of what weather can do to the ice pack.